Revenue measurement
12 SEO KPIs That Actually Tie to Revenue
12 SEO KPIs ranked from leading to lagging: impressions, AI citations, organic conversion, pipeline and closed-won, plus a dashboard layout you can build.
By the gtmind teamPublished 9 min read
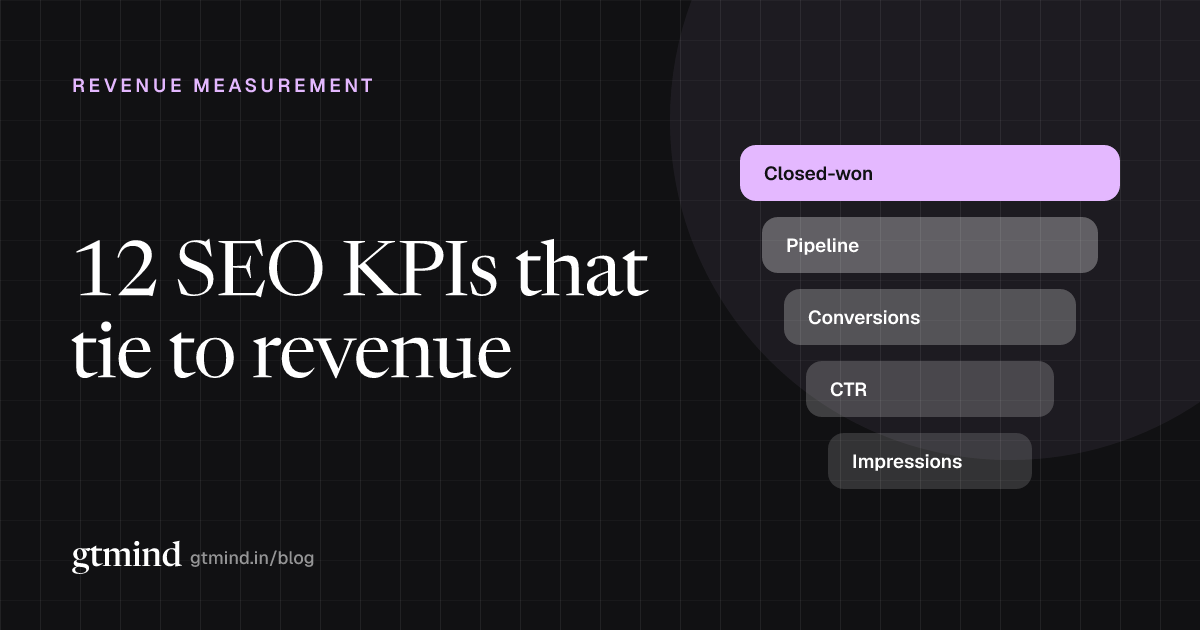
SEO KPIs are the few search metrics you commit to moving because they predict or measure business results. In B2B, useful SEO KPIs form a ladder: leading indicators such as impressions and AI citations, middle metrics such as organic conversion rate, and lagging outcomes such as organic pipeline, closed-won revenue and CAC payback.
Key takeaways
- A metric is anything you can count. A KPI is a metric with an owner, a target and a direct line to revenue.
- Arrange SEO KPIs as a ladder. Leading KPIs move in weeks, lagging KPIs in quarters, and you need both.
- The 12 KPIs below each come with a formula, a data source and a target. Where no trustworthy benchmark exists, set your own baseline.
- The whole ladder fits in one SEO reporting dashboard built on Search Console, GA4 and your CRM, joined by landing page.
- Stop reporting sitewide average position, bounce rate and third-party authority scores to leadership.
KPI vs metric: what's the difference?
Search Console alone offers dozens of SEO metrics. Very few of them deserve to be KPIs. A metric becomes a KPI when three things are true: someone owns it, it has a target for a period, and moving it plausibly moves revenue.
"Total keywords ranked" is a metric. "Non-branded keywords in the top 10 for our 50 buying-intent terms" is a KPI, because it is specific, owned and tied to pages that produce deals. The difference matters because flat lists of 20 SEO metrics invite teams to report whichever one went up this month.
The SEO KPI ladder: leading, middle and lagging
Most SEO KPI examples you'll find online treat every metric as equal. They aren't. Some move within days of a change, some take a full sales cycle. Arranging them by lag makes the report readable and stops anyone judging SEO on revenue two weeks after a page shipped.
| Rung | KPIs | Moves in | Main source | Question it answers |
|---|---|---|---|---|
| Leading | 1-4: impressions, top-10 keywords, AI citations, indexed pages | Days to weeks | Search Console, AI tracking | Are we becoming visible? |
| Middle | 5-8: CTR, engaged sessions, conversion rate, qualified leads | Weeks | GA4, CRM | Is the visibility turning into demand? |
| Lagging | 9-12: pipeline, closed-won, SEO ROI, CAC payback | Months to quarters | CRM, finance | Is the demand turning into revenue? |
Read the ladder bottom-up when deciding what matters, and top-down when diagnosing a problem. If pipeline is flat, check whether conversion fell or whether impressions never grew in the first place.
The 12 SEO KPIs, with formulas and targets
Leading KPIs
1. Non-branded impressions
- Definition: How often your pages appeared in Google results for queries that don't contain your brand name. Search Console counts an impression each time a link to your site is seen on a results page.
- Formula: Sum of impressions where query does not match your brand terms.
- Where to get it: Search Console Performance report, filtered with a query regex that excludes brand variants.
- Target: Set your own baseline. Aim for steady month-over-month growth on your priority topic clusters rather than a sitewide number.
2. Priority keywords in the top 10
- Definition: The share of a fixed list of buying-intent keywords where you rank on page one.
- Formula: Priority keywords ranking 1-10 ÷ total priority keywords.
- Where to get it: A rank tracker, or Search Console average position per query for your list.
- Target: Set your own baseline. Choose 30-100 keywords tied to product, comparison and problem pages, and keep the list stable so the trend means something.
3. AI citation share
- Definition: How often AI answers (Google AI Overviews, ChatGPT, Perplexity, Gemini) cite or mention your site for your tracked prompts.
- Formula: Prompts where you're cited ÷ total tracked prompts.
- Where to get it: An AI search visibility tool, or manual checks on a fixed prompt set. Note that Search Console includes AI Overviews and AI Mode within its "Web" totals and doesn't break them out.
- Target: Set your own baseline. This matters more each year: Ahrefs found an AI Overview correlated with a 34.5% lower CTR for the top-ranking page, so being cited inside the answer is increasingly where the visibility is. Our guide to LLM SEO covers how to earn those citations.
4. Indexed priority pages
- Definition: The share of pages you want in search that Google has actually indexed.
- Formula: Indexed priority URLs ÷ submitted priority URLs.
- Where to get it: Search Console Page indexing report, filtered to your sitemap.
- Target: Close to 100% for product, pricing, comparison and core content pages. Anything else is a technical problem to fix before the other KPIs can move.
Middle KPIs
5. Organic click-through rate (CTR)
- Definition: The share of impressions that became clicks.
- Formula: Clicks ÷ impressions, for non-branded queries.
- Where to get it: Search Console Performance report.
- Target: Compare against position, not a single number. Advanced Web Ranking's July 2026 data puts average CTR at about 20% for position 1, 10% for position 2 and 4% for position 3 on Google US, and reports AI Overviews cut first-position CTR by 52%. A page ranking 3rd with a 1% CTR has a title or snippet problem.
6. Organic engaged sessions
- Definition: Organic visits where someone actually read or did something. GA4 counts a session as engaged if it lasts longer than 10 seconds, has a key event, or has 2 or more page views.
- Formula: Engaged sessions from the Organic Search channel. Engagement rate = engaged sessions ÷ sessions.
- Where to get it: GA4 Traffic acquisition report, session default channel group = Organic Search.
- Target: Set your own baseline by page type. Blog posts and pricing pages behave differently, so compare each against its own history.
7. Organic conversion rate
- Definition: The share of organic sessions that produced a lead: a demo request, trial, contact form or content download you count as a lead.
- Formula: Organic key events (lead types only) ÷ organic sessions.
- Where to get it: GA4 with lead forms marked as key events, segmented by landing page.
- Target: First Page Sage's B2B SaaS benchmarks put SEO visitor-to-lead conversion at 2.1%, based on its own client base. Expect product and comparison pages above that and top-of-funnel posts below it.
8. Organic-sourced qualified leads (SQLs)
- Definition: Leads whose first touch was organic search and that sales accepted as qualified.
- Formula: Count of SQLs where original source = organic search. Track MQL-to-SQL rate alongside.
- Where to get it: CRM, using the original source property (HubSpot) or lead source field (Salesforce, Pipedrive).
- Target: The same First Page Sage benchmark reports 41% lead-to-MQL and 51% MQL-to-SQL for SEO leads. Use these to sanity-check your funnel, then target your own trend.
Lagging KPIs
9. Organic-sourced pipeline
- Definition: The value of open opportunities whose first touch was organic search.
- Formula: Sum of opportunity amount where original source = organic search, created in the period.
- Where to get it: CRM opportunity or deal reports.
- Target: Set your own baseline. This is usually the single best KPI to show leadership. It is also where B2B marketing KPIs for SEO and for paid channels can be compared on the same terms.
10. Organic closed-won revenue
- Definition: Revenue from deals that closed and started with organic search.
- Formula: Sum of closed-won amount where original source = organic search.
- Where to get it: CRM, ideally reconciled with finance.
- Target: Set your own baseline. First Page Sage reports a 36% opportunity-to-close rate for SEO-sourced deals, useful for forecasting closed-won from pipeline.
11. SEO ROI
- Definition: Return on what you spend on SEO: people, tools, content and agencies.
- Formula: (Organic closed-won revenue × gross margin − SEO cost) ÷ SEO cost.
- Where to get it: CRM for revenue, finance for cost.
- Target: Set your own baseline, and measure over at least 12 months. Our SEO ROI guide walks through the formula with real inputs instead of estimated conversions.
12. SEO CAC payback
- Definition: How many months of gross profit from organic-sourced customers it takes to recover what you spent acquiring them.
- Formula: SEO cost in the period ÷ (new organic customers × monthly gross profit per customer).
- Where to get it: Finance and CRM.
- Target: The 2026 Aleph × Benchmarkit report puts median blended CAC payback for B2B SaaS at 16 months, with the top quartile at 6 months or less. SEO often beats the blended figure once content is paid for, which is the case for keeping it funded.
Which SEO KPIs to track by stage
Not every company should track all 12 on day one. A brand-new site has no organic pipeline to report, and a scale-up that obsesses over impressions is looking at the wrong rung.
| KPI focus | New site (0-12 months) | Scale-up (established organic traffic) |
|---|---|---|
| Headline KPI | Indexed pages, non-branded impressions | Organic-sourced pipeline |
| Weekly check | Top-10 keywords, AI citations | CTR on top pages, decaying pages |
| Monthly check | Engaged sessions, first leads | Conversion rate by page type, SQLs |
| Quarterly check | First organic opportunities | Closed-won, SEO ROI, CAC payback |
| Main risk | Judging on revenue too early | Chasing traffic that doesn't convert |
The rule of thumb: report the rung you can actually move this quarter, and show the rungs above it as trend lines so nobody forgets where it has to lead.
The SEO reporting dashboard: a Looker Studio layout
You don't need a paid tool to report this ladder. A Looker Studio SEO dashboard with three data sources covers it. Here is a layout you can build in an afternoon.
Data sources
- Search Console via the native Looker Studio connector. The connector offers two tables, Site Impression and URL Impression, and a data source can use only one, so add both: Site Impression for query-level views, URL Impression for page-level views. For large sites, the bulk data export to BigQuery avoids the row limits of the API.
- GA4 via the native connector, filtered to session default channel group = Organic Search.
- CRM via BigQuery or a scheduled Google Sheets export of contacts and deals, with columns for first-touch source, first landing page URL, deal amount, stage and close date.
Join everything on a normalized landing page URL (lowercase, no query string, no trailing slash). That shared key is what lets one chart show a query, the page it landed on and the deal it became.
Pages and charts
| Page | Charts | Data source |
|---|---|---|
| 1. Revenue summary | Scorecards for KPIs 9-12 with prior-period comparison; monthly organic pipeline bar chart | CRM |
| 2. Visibility | Non-branded impressions time series; top-10 keyword share; indexed pages scorecard; AI citation share | Search Console, AI tracking sheet |
| 3. Engagement and conversion | CTR by position bucket; engaged sessions and conversion rate by page type; SQL funnel | Search Console, GA4, CRM |
| 4. Page table | One row per landing page: impressions, clicks, CTR, engaged sessions, leads, pipeline, closed-won | Blended on landing page |
| 5. Movers | Top 10 gaining and losing pages by clicks and by pipeline, with notes column | Search Console, CRM |
Page 4 is the one that changes decisions. Sorting pages by pipeline instead of traffic usually reshuffles the priority list: a comparison page with modest clicks can outrank a popular blog post.
Add a date-range control and a brand/non-brand filter to every page, and keep a text box at the top of page 1 for the monthly "what changed and why" summary.
An illustrative example of the kind of finding a joined model like gtmind surfaces (not real customer data): "Your integrations page ranks 8th for a query that preceded five closed-won deals last quarter; moving it into the top 3 is worth more pipeline than any blog post on the site." gtmind builds that join by reading Search Console, GA4 and your CRM read-only, as shown in how it works. If you'd rather build it yourself, the layout above gets you most of the way.
SEO KPIs to stop reporting
Some SEO metrics look good in slides and change nothing. Keep them for diagnosis, drop them from the leadership report.
- Sitewide average position. It mixes branded, irrelevant and long-tail queries. A new page ranking 60th for a thousand terms drags it down while revenue goes up.
- Bounce rate. In GA4 it is simply the share of sessions that were not engaged, the inverse of engagement rate. Report one, not both.
- Domain authority and similar scores. These are third-party estimates, not Google metrics. Useful for link prospecting, not as a KPI.
- Total backlinks. Count links that point to pages you want to rank, from sites your buyers read. Raw totals reward spam.
- Total keywords ranked. Grows with every page you publish, whether anyone clicks or not.
- Raw organic traffic without conversion. Traffic is a middle metric at best. Growth in sessions that never become leads is a cost, not a win.
A good test for any metric on your SEO reporting dashboard: if it dropped by 20% next month, would you change what you do? If not, it isn't a KPI.
Frequently asked questions
What are the most important SEO KPIs?
For a B2B company, the most important SEO KPIs are the ones closest to revenue: organic-sourced pipeline, closed-won revenue from organic, and organic conversion rate. Track leading indicators such as non-branded impressions, top-10 keywords and AI citations too, because they move weeks before revenue does. Report no more than three to five KPIs to leadership.
How do you measure SEO performance?
Measure it in three layers. Use Google Search Console for visibility (impressions, clicks, position), GA4 for what organic visitors do on the site (engaged sessions, conversions), and your CRM for what those visitors became (pipeline and revenue). The hard part is joining them by landing page so you can see which queries and pages produced deals.
What should be in an SEO report?
A good SEO report opens with revenue outcomes (organic pipeline and closed-won), then shows the middle of the funnel (organic conversion rate and qualified leads), then leading indicators (impressions, rankings, AI citations). Add the top gaining and losing pages, a short explanation of why numbers moved, and the actions planned for next month.
What is a good organic conversion rate for B2B?
First Page Sage's B2B SaaS benchmarks put SEO visitor-to-lead conversion at about 2.1 percent, based on its clients. Treat that as a reference point, not a target. Blog pages convert lower than product and comparison pages, so measure the rate by page type and compare each against its own history.
How often should you report SEO KPIs?
Check leading indicators weekly, since rankings and impressions move fast and early drops are cheap to fix. Report middle-of-funnel KPIs monthly. Review pipeline, revenue and CAC payback quarterly, because B2B sales cycles mean organic deals often close months after the first visit.
Keep reading
Revenue measurement
How to Measure SEO ROI (With Real Revenue, Not Estimates)
The SEO ROI formula with a worked example, a free calculator, and a step-by-step method for tying search queries to real CRM revenue instead of estimates.
10 min read

AI search
LLM SEO: How to Get Your Brand Cited in AI Answers
LLM SEO gets your pages cited in ChatGPT, Gemini, Perplexity and AI Overviews. A five-step playbook, from crawler access to tying citations to pipeline.
13 min read

AI search
The 10 Best AI Search Visibility Tools, Compared
Ten AI visibility trackers compared on engines covered, verified pricing and fit, plus why their numbers disagree and what to do once the dashboard shows a gap.
12 min read